So, you’ve got 48 hours to kill. What do you do? Well, you could ‘do’ Vegas. You could, perhaps, read the whole of the Guru Granth Sahib. You could watch the film 48 Hrs 30 times.
Or. You could hang out with some cool folks who have given up their free time to work together to do interesting stuff with data. All in the name of developing better public services. Which is exactly what I did last weekend at the Learner Journey Data Jam, when I joined an intrepid band of developers, designers, learners and educational policy types to experiment and make stuff with learner data.
48 hours? Seriously?
Of course, the jam wasn’t the start — or the end — of the learner journey ‘journey’. The story began early in 2012 when design agency Snook were commissioned to work with the Scottish Government to research ‘Improving the Learner Journey’. The research aimed to develop new insights into the learner’s experience of the Scottish education system by understanding first-hand how learners see their ‘journey’ and how they make decisions based on the information, products and services available to them.
It was clear from the resultant research report that a single point of contact for planning and reviewing the learner journey was needed. This is now being developed in the form of an internet-based visual route map.
The Scottish Government has taken a user experience design approach throughout the project — and the data jam was an opportunity for the project to explore the technical potential of the learning data currently collected to help learners on their educational journey.
The jam itself was mostly the hard work of Lizzie Brotherston, a designer ’embedded’ in the Scottish Government to work on the Learner Journey Project. In addition to the usual admin stuff and making sure ‘jammers’ were well fed (absolutely crucial to the success of a jam), Lizzie worked tirelessly behind the scenes to get useful datasets made available. These included sets of courses, institutions, statistical analysis of destinations and options. Most of it was only snapshot data — which meant that only prototypes could be built.
Lizzie also developed themes and personas to provide inspiration and some key digital and design principles had been extracted from the Snook research. These were sent to attendees in the run up to the jam. So, once the scene had been set (by various speakers, including, from the Scottish Government: Harriet Hunter, Creativity Lead and Ben Plouviez, who talked about the Scottish Government’s approach to opening up data) and those with ‘Friday opening only’ tickets had been thrown out, there were already lots of ideas being kicked around by the serious ‘jammers’.
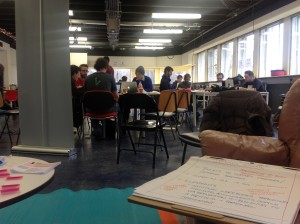
Teams had formed around these ideas, and work was in full flow, by the time I arrived back at TechCube on Saturday morning.
What was really nice to see was how well everyone worked together — designers, developers and those with the subject expertise. Many of these guys hadn’t met each other prior to the jam. There were long periods of silence over the weekend when everyone had their heads down. But these were punctuated by lots of laughter (and possibly a bit of hysteria as the deadline got nearer!)
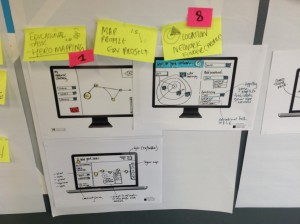
What was also nice was how ‘lo-fi’ a lot of the process is. I think some people are put off from attending this sort of event because they fear it will be too ‘techy’ for them. But a lot of the design process is facilitated with pen and paper (sticky notes are another jam essential!).
48 hrs later
We opened the doors and welcomed interested parties back for the show-and-tell on Sunday afternoon. What was created over the weekend was truly impressive. I was chuffed to be asked to help judge (there were six medals on offer, including for the ‘most innovative use of the data’, the ‘I can’t believe you built that in a weekend’, etc). Well, chuffed until it actually came to doing the judging. Wow, that was hard, man.
The winner of the ‘best overall hack’ medal was Course Finder. This is a deceptively simple course finder tool that allows learners to search for any SQA level course in Scotland — with filters including location, qualification or SCQF level. Results are plotted on a map. May not sound like much, but nothing like it existed before the jam.
You can check out all the prototypes on the Learner Journey website. Just to highlight a few, my personal favourites were:
- CourseMap: an explorative infographic of all the courses offered in the UK, comparing them with jobs you could get if you complete that course.
- Hero: navigable map that details the learner journeys of local heroes, celebrities, and people in jobs that hold particular stature for a particular audience.
- Wolf Pack: an online community where ‘packs’ of like-minded people come together both online and offline to share information on specific topics.
What now?
Well, it seems that public sector hackathons are a bit like buses, you wait years for one and then three turn up at once! We had NHS Hack Scotland at the end of March. The Learner Journey Data Jam was the first ‘official’ Scottish Government data hack event. And we had the Project Ginsberg hack this weekend – a joint Scottish Government, NHS24 event with a focus on mental health.
The Learner Journey Project is part of the Scottish Government’s commitment to becoming a more creative organisation — delivering fresh insights into issues facing Scotland, through creative approaches. For some time, I’ve been attending jams, hackathons and similar events out of personal interest, but having recently joined the Scottish Government’s Creativity Team, I now have an ‘official’ interest. So I can tell you that we have plans in place to the share learning from these events within the organisation and across the public sector more widely. I think you can expect to see more events like the Leaner Journey Data Jam!
In the meantime, if you’ve got a spare 48 hours and fancy trying out this hackathon lark for yourself, the Aberdeen 2017 bid team are hosting a ‘Cultural Hackathon’ in Aberdeen over the first weekend in May. Another great opportunity to spend 48 hours collaborating, building and sharing!


2 thoughts on “Jamming with Learner Journey Data”
Comments are closed.