
Air Pollution in Scotland
Air pollution concentrations are so high they are breaking national safety standards and damaging health in many parts of Scotland. Edinburgh, Glasgow, Dundee, Aberdeen, and even less likely places such as Inverness, all have Pollution Zones where toxic air levels regularly break Scottish regulatory standards — standards which were due to be achieved in 2005.
80% of urban air pollution is caused by road traffic, which is why Friends of the Earth Scotland is calling for urgent action on transport. We want the Government to spend 10% of its transport budget on walking and cycling, to improve public transport so that more people use it, to look at traffic controls such as congestion charging, and to improve vehicle emission standards through a network of fully funded Low Emission Zones across the country.
The health impacts of air pollution are frightening. Across Scotland, over 2,000 people die early every year from exposure to fine particles alone.
When there is an air pollution “spike” or “episode”, asthmatics have a higher risk of an attack. But even exposure to pollution levels which are lower than the regulatory limits are still damaging to health if it persists over a long period. Regular exposure to the levels of pollution that we see day in, day out on city streets in Scotland increases the risk of people with heart conditions having a heart attack or stroke. Worryingly, air pollution impacts on foetal development, with newborn babies more likely to have lower birth weights if expecting mothers are exposed to air pollution throughout pregnancy.
Air pollution is like passive smoking in that it is often inflicted upon those not responsible. But whereas you can smell and see cigarette smoke, air pollution is largely invisible. So how can we empower ourselves to better understand what pollution levels are like on a day-to-day and longer term basis?
The unhappy truth is that the best way to detect high air pollution levels is by speaking to someone with asthma. A friend who I have made through the air pollution campaign, Anne Hay, is an asthma sufferer and describes herself as the canary in the coal mine, because she suffers terrible symptoms when the air is poor and can warn friends before any official data displays the problem.
Here are two less accurate, but more official, ways to understand what pollution levels are like in your area.
1. Scottish Air Quality Website
Visit the Scottish Government’s Scottish Air Quality Website for live air quality readings. These readings come from 91 air pollution monitors, which resemble large electricity boxes and measure air pollution on a continual basis.

Advantages:
- Live data: These monitors are updated on an hourly basis so give us the most current information and will highlight air pollution “spikes” or episodes.
- Variety: Some of the monitors measure for a range of different pollutants (ozone, Nitrogen Dioxide, coarse particles and fine particles)
Disadvantages:
- Misleading “traffic light” system: Air pollution levels are tiered into different colours, with monitor icons displayed as green, yellow, red or purple depending on how bad the pollution is. A monitor coloured yellow and beyond has pollution levels breaking short-term standards. The problem with this is that monitors may show green all year round and still break the long-term, annual standards. People at that location will suffer damage to health even though the picture is a “green” one.
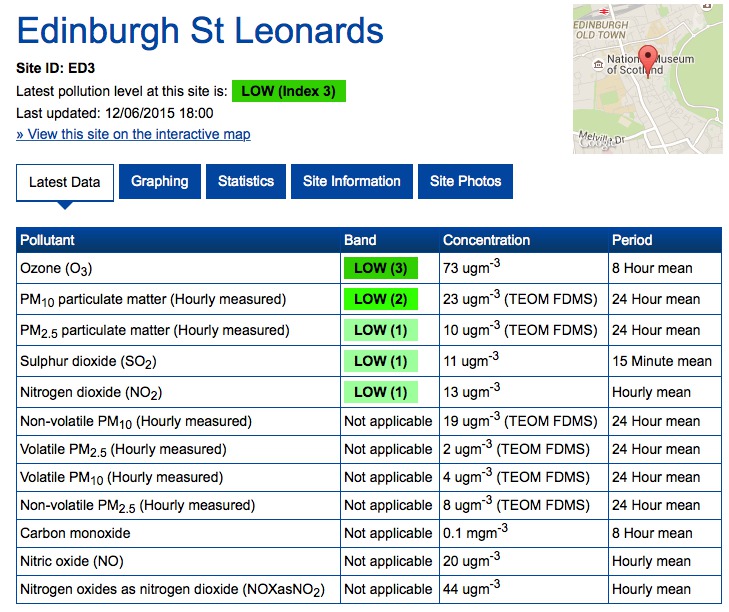
- A pixelated picture: With air pollution only measured at 91 locations in this way, the monitoring station network doesn’t provide a high resolution picture of the problem; air pollution levels vary a lot from street to street. For example, the St Leonard’s automatic monitoring station in Edinburgh does not give an indication of what pollution levels are like on Nicolson Street even though it’s only 100m away. It is a “background” site; levels will be much higher on Nicolson Street where there is more traffic. So if you are an asthma sufferer trying to find out which parts of the city to avoid, this data is not of much use.
- Monitors can be faulty: technology always has its limitations and sometimes monitors can play up and give odd readings. The data is ratified and corrected on a quarterly basis. A safe rule of thumb is that last year’s data should be accurate; or to caveat current results as being “provisional” and paying close attention to any outliers.
- Accessibility: Small amounts of data are displayed as HTML, as shown above. However, if you want a larger dataset in a machine-readable format, you must fill out a form so that the data is emailed to you as a CSV file, or else deposited on an FTP site for later download. (Historical air quality data for the monitors in Scotland can be downloaded in Excel format from Scottish Environment Statistics Online.)
2. Diffusion tube data from your local authority
Councils monitor and record air pollution concentrations at the local level and they provide annual air quality updates called “Air Quality Progress Reports” which can be Googled and are available on council websites.
Local councils monitor air quality through the use of some automatic stations, as well as through a wider network of “diffusion tubes” dotted around the city. These small tubes, around 8cm in length, look a bit like test tubes, and provide long-term averages of NO2 levels which are usually displayed in Council reports as annual averages, though some Councils will display month-to-month readings.
Advantages of diffusion tube data:
- Higher resolution picture: There are many more of these tubes; there are over 100 in Edinburgh alone.
Disadvantages:
- Old data: It takes time to collect, process and correct data from the tubes, so usually the most up to date data which can be accessed is from the previous year. For example, the most up to date corrected data from Edinburgh Council is from 2013 which is not much use to an asthma sufferer wanting to know what pollution levels are like right now.
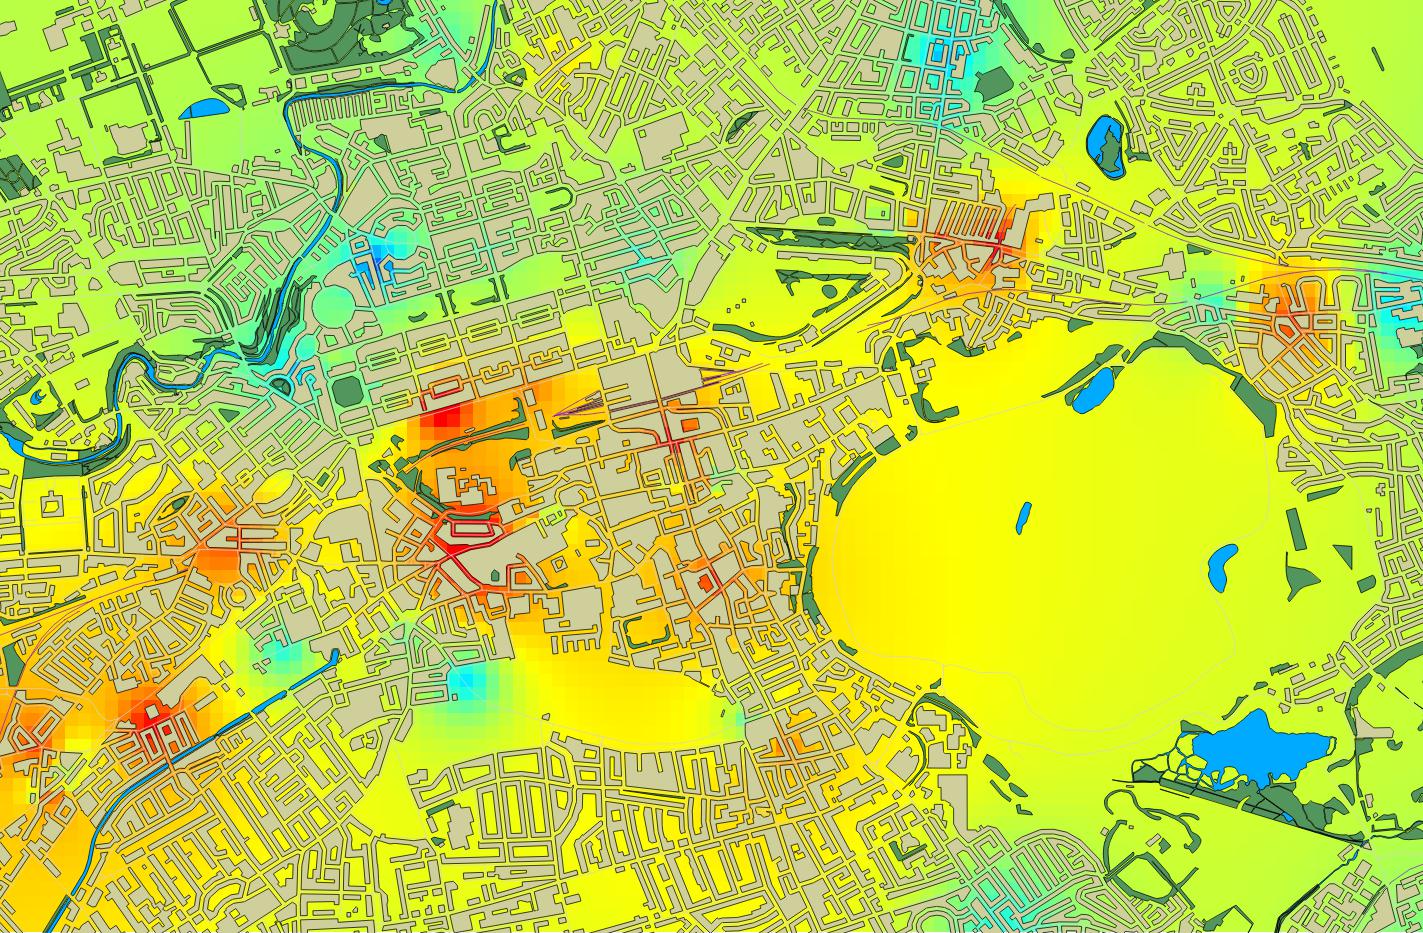
- Difficult to access and use: Most Council data is displayed in PDF formats, making it tricky to use. When our director, Richard, produced this GIS heat map of Edinburgh’s air pollution using council data, we both spent around 2 hours copying and pasting individual cells into excel – that’s 2 hours of our lives we’ll never get back!

From a campaigning perspective, the air pollution data that is out there is crucial as it gives a strong mandate for action on transport. But with data tucked away in Appendices of obscure reports in dark corners of Council websites, and with limited live data, the public is not as informed as it should be.
However, advances are now being made with mobile air pollution monitors coming on to the market. Personal air pollution sensors which you can strap to yourself give a much clearer picture of what air pollution levels are like and how they vary from place to place. We would like to see much more of these made readily available so that people are able to access real live data on air pollution levels where they are. This would be the ideal way to give air pollution the visibility it needs so that there is a stronger public mandate for life-saving action on transport.
Click here to subscribe to regular updates on Friends of the Earth Scotland’s air pollution campaign and here to find out more about Friends of the Earth Scotland.